The chocolate bar is a compact way to encounter a large agricultural system. Its wrapper gives the weight, ingredients and price. It usually says little about when the cocoa was bought, what happened to the trees that produced it or how a farmer’s payment relates to the market quotation in the news.
That omission becomes conspicuous during a price shock. A rising cocoa chart can turn a familiar treat into a small weather bulletin. When the chart falls, the obvious question follows: why has the bar not become cheaper at the same speed?
The answer lies partly in five clocks running at different rates: weather, the tree, the marketing season, the manufacturer’s purchasing cycle and the household’s shopping routine. Calling every difference a delay misses the fact that each clock measures a different decision.
The weather clock
Cocoa’s recent market story is not a one-way climb. In its mid-2026 review of beverage markets, the World Bank reported cocoa averaging $4.35 a kilogram in June, still more than half below a year earlier despite a recent increase. The account linked an improved supply outlook with favorable West African weather and softer demand. That is a dated market observation, not today’s quotation or a prediction that prices cannot rise again.
The same review identifies Côte d’Ivoire and Ghana as producing about 60% of world cocoa. Concentration matters because conditions affecting these countries can influence a large share of supply. It does not imply that the two countries experience identical weather or that every farm responds in the same way.
A price shock should therefore be read through both the crop and the supply structure. A weather event in a major producing region can be important, but its market effect depends on inventories, the condition of trees, other production and demand. Describing cocoa as “expensive because of climate” can be directionally suggestive while failing to explain a particular season’s movements.
There is also a difference between weather affecting one harvest and a changing climate affecting long-lived investment. A better season can improve current output without resolving the conditions under which farmers must decide what to plant, rehabilitate or maintain. A recovering market supply is not the same as a completed adaptation of the agricultural system.
The tree clock
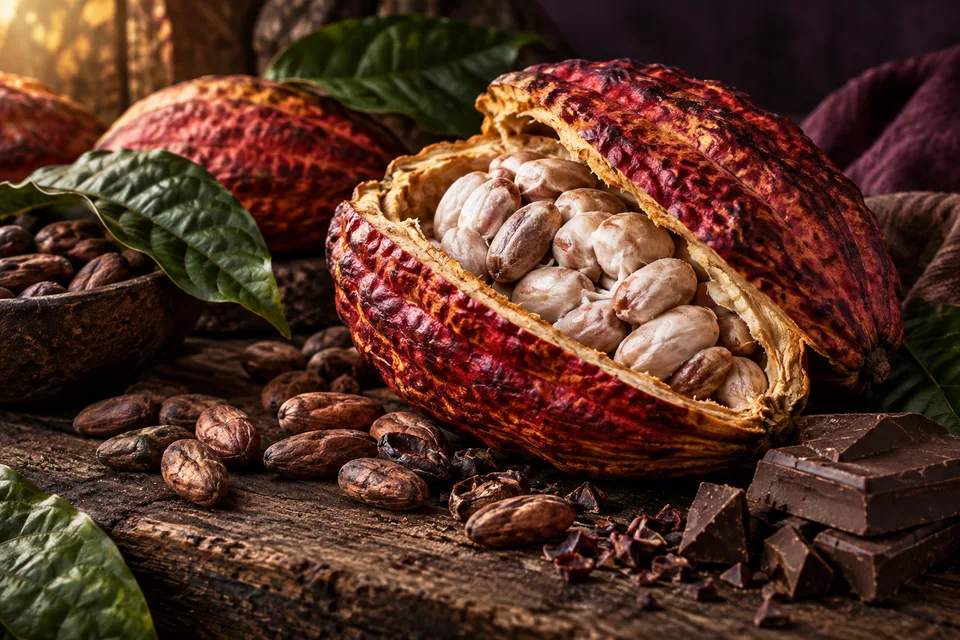
The cacao tree does not respond to a high quotation by supplying another shipment next week. It is a living perennial with a production cycle, growing conditions and health risks. Maintaining or replacing it requires decisions whose consequences extend beyond a single sales season.
Kew’s botanical account of Theobroma cacao places its origins in tropical South American forests and describes its association with humid conditions and insect pollination. The geographic origin of the plant and the present concentration of commercial production are different facts. A commodity can become globally familiar while remaining dependent on a particular set of biological relationships.
The small flowers are a useful reminder of that dependence. A chocolate bar starts with successful fruit development, not with a standardized factory input. Research into pollination, plant health and growing conditions concerns the amount and reliability of a crop long before a processor measures its bean inventory.
Disease adds a timetable that weather alone cannot explain. Ghana’s Cocoa Health and Extension Division identifies control of cocoa swollen shoot disease, rehabilitation of old farms and support for replanting among its functions. Its work includes surveys, treatment, improved planting material and reinspection; rehabilitation can mean cutting out old, unproductive trees before replacements are established. Replacing affected or unproductive trees is an agricultural program, not a transaction that can be completed by offering a higher spot price.
For a household depending on the farm, rehabilitation raises a practical question: how is the transition supported before replacement production arrives? The exact answer depends on the program and farm. The general problem is that an investment useful for long-term supply can create a short-term gap in the grower’s income or workload. A supply-chain discussion that celebrates replanting without examining the intervening livelihood misses an essential part of whether it can happen.
The Seed Production Division’s account also identifies farmers replanting after disease treatment and replacing old trees among its intended recipients. The existence of a planting-material service is one component of renewal. It does not by itself establish that every farmer receives sufficient support or that every replanted site performs as intended.
The marketing clock
“The cocoa price” can mean several things. The International Cocoa Organization’s statistical explanation defines its daily indicator using nearby London and New York futures quotations, with currency conversion. It also defines a cocoa year running from October to September and describes quarterly revisions to production and grinding data. These conventions help compare a market; they are not a record of every farmer’s sale.
A futures-derived indicator, an export contract and an administered producer price therefore need different labels. The currency and date matter too. Comparing a local-currency payment with a dollar quotation can confuse an exchange-rate movement with a change in the underlying commercial terms.
Ghana’s 2025–26 season illustrates the separation. In its August 2025 producer-price announcement, COCOBOD described a price of GHS51,660 per tonne and explained that its export-value calculation included outstanding earlier contracts and a forecast. The reference was not simply that day’s highest world quotation multiplied by an exchange rate.
Then, in a 12 February 2026 reform statement, the authorities announced a lower producer price of GHS41,392 per tonne for the remainder of that season, citing falling world prices and liquidity pressures. These are the dated terms of that season and the issuing authority’s explanation, not a claim about the currently applicable 2026–27 payment or an independent audit of the sector.
The sequence shows why a high international price cannot be treated as a complete income statement for growers. Payment arrangements, prior commitments, costs, currency and the timing of actual sales all intervene. It also shows why stability is difficult: an attempt to set a predictable season price must still interact with a moving market.
None of this means farmers are insulated from the price shock. It means the transmission needs to be investigated rather than assumed. A grower can face both a change in price and a change in crop quantity. A higher unit payment does not guarantee a higher annual income when fewer beans are available to sell.
The factory clock
A manufacturer needs cocoa ingredients when it produces chocolate, but it does not necessarily purchase them on that day’s market. Purchasing schedules, inventories and contracts can spread the exposure across time. The details differ by company, so a general article cannot infer a particular producer’s margin from a commodity chart.
There are also several stages between beans and a wrapped bar. Processing, ingredients, labor, energy, packaging, distribution and retail all contribute to the final product. A change in one agricultural input is important without being the same percentage change in every part of the shelf price.
Consider a purely fictional bar with a retail price of $3. Suppose its cocoa-related cost is 60 cents under a deliberately simplified accounting boundary. If that cost doubles and every other cost is held constant, the added amount is 60 cents, not another $3. The example is arithmetic, not an estimate of an actual bar’s cost structure or a prediction of how a retailer would price it.
The reverse calculation has the same limit. A halving of a current bean quotation cannot be translated directly into a halving of a finished bar’s price. Existing purchases, processing and the rest of the product still matter. That explains why proportional instant pass-through is an unrealistic benchmark; it does not excuse every price decision or establish that competition is functioning well.
Assessing a company’s behavior requires its own evidence: the product, period, purchasing exposure, costs and pricing choices. A comparison that ignores those details can mistake delayed cost pressure for opportunism, or use a vague supply-chain explanation to avoid scrutiny that is warranted. The chart is a starting point for questions, not a verdict.
One additional indicator needs care: grindings measure beans processed, rather than the number of chocolate bars bought by households during the same period. A processor’s activity and a retailer’s sales are linked through inventories and other products. A change in processing can signal pressure in the chain without being a direct measurement of every consumer’s appetite for chocolate.
This becomes important when interpreting a lower market price as an unqualified improvement. If the fall partly reflects weakened demand, some businesses may be producing less rather than simply enjoying cheaper inputs. If it reflects a better crop, the implications differ again. The same downward line can contain several mechanisms, and the distribution of benefit depends on which of them is operating.
The World Bank’s July account adds an inventory measure: estimated stocks equaled 43% of annual grindings, compared with a long-term average of 41%. That ratio places the price retreat beside the beans available relative to processing activity. It is not a prediction that every factory has secured its next purchase. Stocks sit within a trading system, while a manufacturer needs suitable material at a particular place and time.
The shopping clock
Households encounter the system through a familiar unit. That unit can change. A bar can become smaller, a multipack can contain fewer pieces or a recipe can use a different combination of ingredients. Comparing only the price printed on the shelf can miss a change in what is being purchased.
Weight and ingredients help describe the product, but they do not establish the entire quality judgment. A higher cocoa percentage is a specific recipe characteristic, not a universal score for flavor, agricultural practice or treatment of growers. A chocolate product should be assessed for what it is and for claims it actually makes.
This is also where a volatile commodity becomes a cultural story. Chocolate can be an ordinary snack, a seasonal gift or a carefully made specialty. Manufacturers and shoppers have different room to adjust those uses. A price increase that prompts one household to buy a smaller treat may be a more consequential pressure for a small business built around cocoa-rich products.
The distribution of adjustment matters all the way back to the farm. Consumers can reduce purchases; manufacturers can alter sourcing or products within their commercial constraints. A farmer with established trees and a dependent household cannot switch agricultural systems with the same speed. The chain’s most visible price is not necessarily borne by the participant with the least flexibility.
What a calmer market would not prove
An improved harvest and lower prices can relieve some immediate pressures. They do not prove that disease control, farm renewal, income security or climate resilience have been solved. Equally, the existence of long-term risks does not mean a near-term recovery is imaginary. Both observations can be true on different clocks.
A better account of cocoa would keep those clocks visible. It would label the crop year, distinguish a forecast from a measured harvest, identify the price being cited and ask what support enables growers to maintain the next crop. It would resist treating every movement as a simple moral story about either greedy manufacturers or fortunate farmers.
The chocolate bar can carry a weather report, but weather is only the first page. Behind it are trees that live for years, institutions that set terms for a season and businesses buying against future production. Understanding that system begins when the wrapper’s price stops pretending to be the whole story.
Sources & context
This article draws on the sources linked in the text. Analysis and illustrative scenarios are identified separately from reported findings.
- mid-2026 review of beverage markets
- botanical account of Theobroma cacao
- Cocoa Health and Extension Division
- Seed Production Division's account
- International Cocoa Organization's statistical explanation
- August 2025 producer-price announcement
- 12 February 2026 reform statement